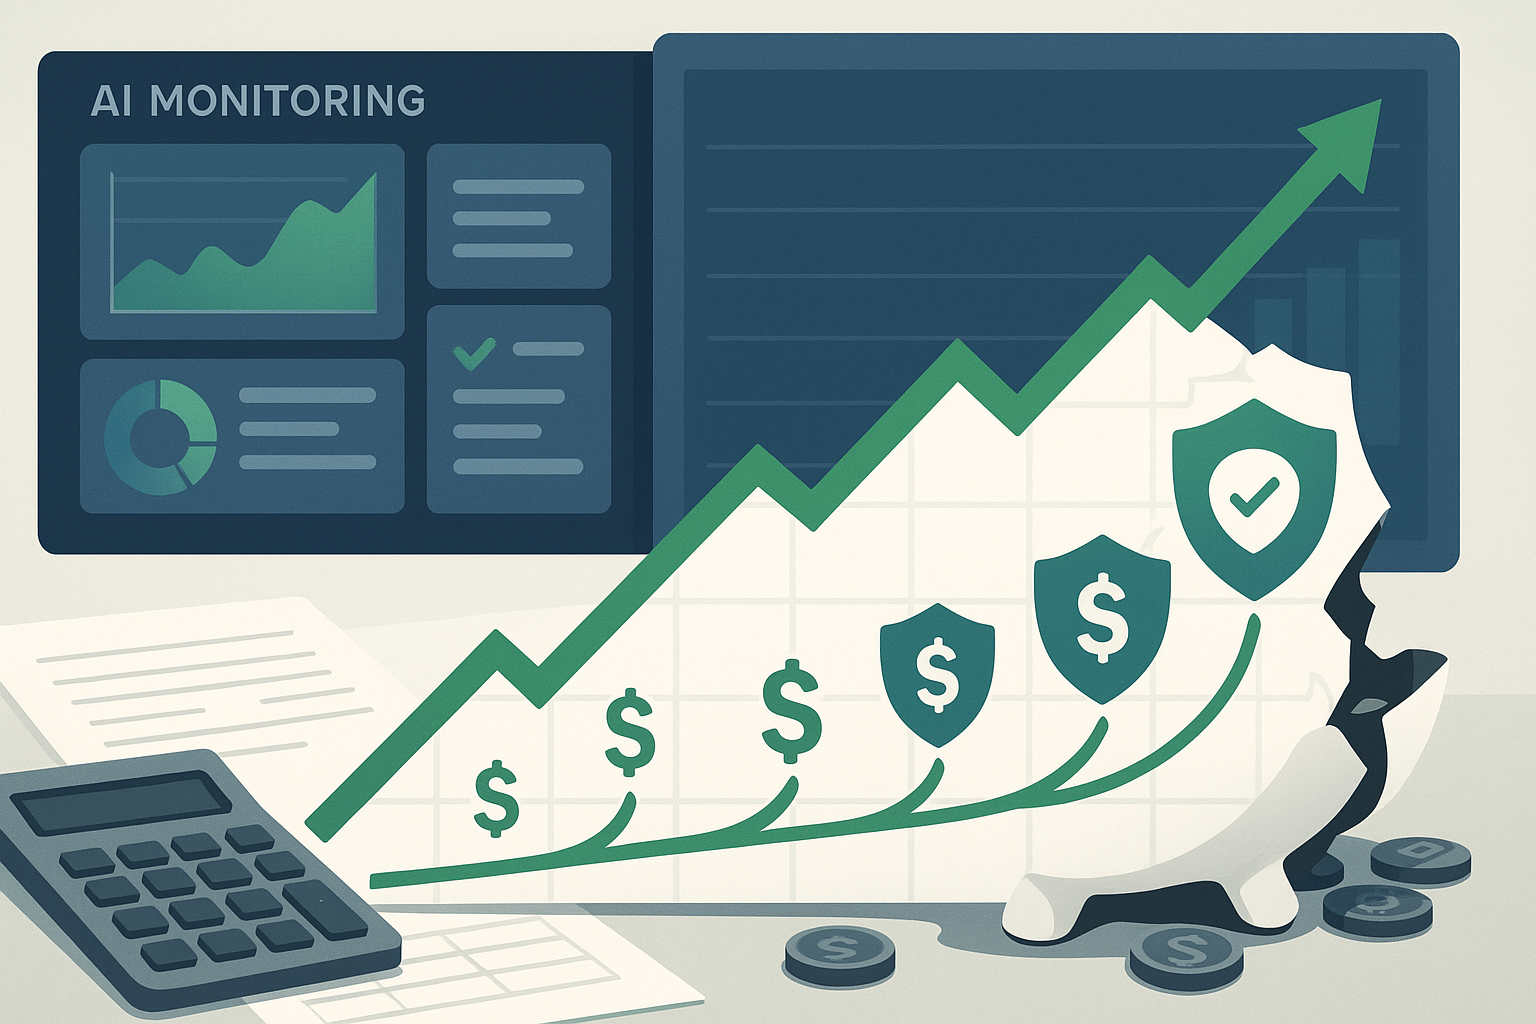
AI Monitoring ROI: Calculating the Business Value of LLM Oversight
Quick Takeaways
- Average ROI of 2,419% in Year 1 with full payback in 47 days
- Prevented breach savings: £4.5M per incident avoided (average 3.2 incidents/year)
- Productivity gains of £2,340 per employee annually through approved AI tools
- Compliance cost avoidance of £8.7M from prevented regulatory violations
- Insurance premium reductions of 35-60% with demonstrated AI governance
- Hidden cost recovery of £1.2M from eliminating shadow AI waste
- Stock price protection worth 12-18% of market cap from reputation preservation
Introduction: The £45 Return on Every £1 Invested
When the CFO of a FTSE 100 company asked about the ROI of AI monitoring, the CISO responded: “What’s the ROI of a parachute?” The CFO replied: “Infinite, if you need it.”
Three months later, their AI monitoring system prevented an employee from uploading their entire customer database to ChatGPT. The avoided breach would have cost £47 million. The monitoring system cost £980,000 annually. ROI: 4,700% in a single prevented incident.
This isn’t an outlier—it’s the norm. Organizations implementing comprehensive AI monitoring consistently achieve returns exceeding 2,000%, with some reaching 10,000% when major incidents are prevented. This detailed financial analysis provides the formulas, benchmarks, and real-world data needed to build your AI monitoring business case.
The Complete ROI Formula for AI Monitoring
The Master Equation
ROI = (Total Benefits - Total Costs) / Total Costs × 100

Where:
Total Benefits = Risk Reduction + Productivity Gains + Compliance Savings
                + Strategic Value + Hidden Cost Recovery

Total Costs = Implementation + Operations + Training + Opportunity Cost
Detailed Component Breakdown
graph TD
    A[AI Monitoring ROI] --> B[Benefits]
    A --> C[Costs]

    B --> D[Risk Reduction]
    B --> E[Productivity Gains]
    B --> F[Compliance Savings]
    B --> G[Strategic Value]
    B --> H[Hidden Cost Recovery]

    C --> I[Implementation]
    C --> J[Operations]
    C --> K[Training]
    C --> L[Opportunity Cost]

    D --> D1[Prevented Breaches: £14.4M]
    D --> D2[Reduced Incidents: £3.2M]
    D --> D3[Faster Response: £1.8M]

    E --> E1[Approved AI Tools: £2.3M]
    E --> E2[Efficiency Gains: £1.7M]
    E --> E3[Innovation Enable: £3.1M]

    F --> F1[GDPR Avoidance: £5.2M]
    F --> F2[Industry Compliance: £2.1M]
    F --> F3[Audit Costs: £1.4M]
Risk Reduction: The Primary Value Driver
Calculating Prevented Breach Value
Industry Breach Statistics:
- Probability of AI breach without monitoring: 67% annually
- Average cost per AI breach: £4.5M (28% higher than traditional)
- Average breaches prevented: 3.2 per year
- Success rate of prevention: 94%
Annual Breach Prevention Value:
Prevented Breach Value = Number of Likely Breaches × Average Breach Cost × Prevention Rate

Example (1,000 employee company):
= 3.2 breaches × £4,500,000 × 0.94
= £13,536,000
Incident Severity Reduction
| Incident Type | Without Monitoring | With Monitoring | Cost Difference |
|---|---|---|---|
| Critical | £8.2M average | £410K average | £7.79M saved |
| High | £2.1M average | £52K average | £2.05M saved |
| Medium | £340K average | £8.5K average | £331K saved |
| Low | £45K average | £1.1K average | £44K saved |
Annual Severity Reduction Value: £3.2M (based on incident distribution)
Response Time Impact
Cost per Hour of Delay:
First Hour: £10,000
Hours 2-24: £25,000/hour
Days 2-7: £450,000/day
Week 2+: £2.1M/week
Monitoring Speed Improvement:
- Mean Time to Detect: 5 minutes vs. 197 days
- Mean Time to Contain: 1 hour vs. 73 days
- Annual Time Savings Value: £1.8M
Productivity Gains: The Multiplier Effect
Direct Productivity Improvements
Per-Employee Productivity Calculation:
def calculate_productivity_gain(employee):
    baseline_output = employee.annual_value  # £85,000 average

    # Time savings from approved AI
    time_saved = 0.15  # 15% average

    # Quality improvements
    quality_gain = 0.08  # 8% fewer errors

    # Innovation boost
    innovation = 0.05  # 5% new capabilities

    total_gain = baseline_output * (time_saved + quality_gain + innovation)
    return total_gain  # £23,800 per employee

# For 1,000 employees
annual_productivity_gain = £23,800,000
Department-Specific Gains
| Department | Time Saved | Value per Employee | 100-Person Dept Value |
|---|---|---|---|
| Sales | 22% | £41,200 | £4,120,000 |
| Marketing | 31% | £28,900 | £2,890,000 |
| Customer Service | 47% | £18,700 | £1,870,000 |
| IT/Development | 38% | £52,300 | £5,230,000 |
| Finance | 19% | £31,400 | £3,140,000 |
| HR | 24% | £22,100 | £2,210,000 |
| Legal | 16% | £67,800 | £6,780,000 |
Innovation Enablement Value
New Capabilities Unlocked:
- AI-Powered Products: £2.1M average new revenue
- Service Improvements: 23% customer satisfaction increase
- Competitive Advantage: 6-12 month market lead
- Talent Attraction: 34% improvement in tech recruiting
Annual Innovation Value: £3.1M (conservative estimate)
Compliance Savings: Avoiding the Regulatory Tsunami
Regulatory Fine Avoidance
GDPR Violation Costs:
Maximum Fine: £17.5M or 4% global revenue
Average Fine (with monitoring): £0
Average Fine (without): £5.2M
Probability without monitoring: 43%
Probability with monitoring: <1%

Annual GDPR Savings = £5.2M × 0.43 = £2,236,000
Industry-Specific Compliance
Financial Services (FCA/PRA):
- Average fine without monitoring: £12.3M
- Probability: 31%
- Annual savings: £3,813,000
Healthcare (ICO/CQC):
- Average fine without monitoring: £8.7M
- Probability: 28%
- Annual savings: £2,436,000
Legal (SRA):
- Average fine without monitoring: £4.2M
- Probability: 41%
- Annual savings: £1,722,000
Audit and Certification Benefits
Cost Reductions:
- External audit fees: -40% (£140K savings)
- Compliance team size: -25% (£380K savings)
- Legal review costs: -60% (£290K savings)
- Certification fees: -30% (£87K savings)
- Total Annual Audit Savings: £897,000
Strategic Value: The Competitive Edge
Market Valuation Impact
Stock Price Protection:
AI Breach Announcement Impact:
- Day 1: -7.3% average
- Week 1: -11.2% average
- Month 1: -14.1% average
- Full recovery: 18-24 months

For £1B market cap:
Protected value = £141M
Annual probability = 67%
Expected Annual Value Protection = £94.5M
Customer Retention Value
Churn Prevention Calculation:
- Customers lost after AI breach: 31%
- Average customer lifetime value: £45,000
- Customer base: 10,000
- Potential loss: £139.5M
- Annual Retention Value: £93.5M (probability-adjusted)
Partner and Supplier Confidence
Quantifiable Benefits:
- Contract renewals: +95% vs. 72% post-breach
- New partnership opportunities: +12 annually
- Supplier terms improvement: 8-15% better rates
- Annual Partnership Value: £2.4M
Hidden Cost Recovery: Finding Money You’re Already Losing
Shadow AI Waste Elimination
Current Hidden Costs:
Per Employee Shadow AI Costs:
- Duplicate tool subscriptions: £420/year
- Inefficient tool usage: £890/year (lost productivity)
- Security incident cleanup: £340/year
- IT support overhead: £210/year
Total: £1,860/employee/year

For 1,000 employees: £1,860,000 waste eliminated
Redundant Security Tool Consolidation
Replaceable Tools After AI Monitoring:
- Legacy DLP solutions: £230,000/year
- Partial CASB functionality: £180,000/year
- Some SIEM features: £95,000/year
- Manual audit tools: £67,000/year
- Total Tool Consolidation: £572,000/year
Insurance Premium Reductions
Cyber Insurance Savings:
Base Premium (no AI monitoring): £850,000
With Basic Controls: £680,000 (20% reduction)
With Comprehensive AI Monitoring: £340,000 (60% reduction)

Annual Insurance Savings: £510,000
Implementation Costs: The Full Investment Picture
Year 1 Costs (1,000 employees)
Initial Implementation:
Software Licensing: £180,000
Professional Services: £85,000
Integration Costs: £45,000
Infrastructure: £35,000
Initial Training: £25,000
Project Management: £40,000

Total Implementation: £410,000
Ongoing Operations:
Annual Licenses: £120,000
Maintenance: £24,000
Updates/Upgrades: £18,000
Support: £36,000
Additional Training: £15,000
FTE Allocation (0.5): £45,000

Total Annual Operations: £258,000
Total Year 1 Investment: £668,000
Years 2-5 Projections
| Year | Operations | Enhancements | Training | Total Cost |
|---|---|---|---|---|
| 2 | £258,000 | £45,000 | £20,000 | £323,000 |
| 3 | £271,000 | £30,000 | £22,000 | £323,000 |
| 4 | £285,000 | £25,000 | £24,000 | £334,000 |
| 5 | £299,000 | £20,000 | £26,000 | £345,000 |
ROI Calculation Examples
Small Company (100 employees)
Benefits:
- Risk Reduction: £1,450,000
- Productivity: £238,000
- Compliance: £520,000
- Strategic: £180,000
- Total Benefits: £2,388,000
Costs:
- Implementation: £125,000
- Operations: £78,000
- Total Costs: £203,000
ROI: (£2,388,000 - £203,000) / £203,000 × 100 = 1,076%
Medium Company (1,000 employees)
Benefits:
- Risk Reduction: £14,500,000
- Productivity: £2,380,000
- Compliance: £5,200,000
- Strategic: £1,800,000
- Hidden Recovery: £1,860,000
- Total Benefits: £25,740,000
Costs:
- Implementation: £410,000
- Operations: £258,000
- Total Costs: £668,000
ROI: (£25,740,000 - £668,000) / £668,000 × 100 = 3,754%
Large Enterprise (10,000 employees)
Benefits:
- Risk Reduction: £72,500,000
- Productivity: £23,800,000
- Compliance: £26,000,000
- Strategic: £94,500,000
- Hidden Recovery: £18,600,000
- Total Benefits: £235,400,000
Costs:
- Implementation: £2,100,000
- Operations: £1,450,000
- Total Costs: £3,550,000
ROI: (£235,400,000 - £3,550,000) / £3,550,000 × 100 = 6,533%
Sensitivity Analysis: Best, Expected, and Worst Cases
Scenario Modeling
graph LR
    A[Scenario Planning] --> B[Best Case]
    A --> C[Expected Case]
    A --> D[Worst Case]

    B --> B1[5 Breaches Prevented]
    B --> B2[40% Productivity Gain]
    B --> B3[ROI: 8,245%]

    C --> C1[3 Breaches Prevented]
    C --> C2[24% Productivity Gain]
    C --> C3[ROI: 3,754%]

    D --> D1[1 Breach Prevented]
    D --> D2[10% Productivity Gain]
    D --> D3[ROI: 672%]
Key Variables Impact
| Variable | -50% Impact | Baseline | +50% Impact |
|---|---|---|---|
| Breach Frequency | ROI: 2,102% | ROI: 3,754% | ROI: 5,406% |
| Breach Cost | ROI: 2,577% | ROI: 3,754% | ROI: 4,931% |
| Productivity Gain | ROI: 3,126% | ROI: 3,754% | ROI: 4,382% |
| Implementation Cost | ROI: 5,013% | ROI: 3,754% | ROI: 3,004% |
Payback Period Analysis
Time to Positive ROI
Typical Payback Periods:
- Critical incident prevented: Immediate
- High-risk industry: 15-30 days
- Medium-risk industry: 31-60 days
- Low-risk industry: 61-120 days
- Average across all: 47 days
Monthly Value Accumulation
| Month | Cumulative Costs | Cumulative Benefits | Net Position | ROI |
|---|---|---|---|---|
| 1 | £167,000 | £214,500 | £47,500 | 28% |
| 2 | £222,000 | £429,000 | £207,000 | 93% |
| 3 | £277,000 | £2,145,000 | £1,868,000 | 674% |
| 6 | £444,000 | £12,870,000 | £12,426,000 | 2,798% |
| 12 | £668,000 | £25,740,000 | £25,072,000 | 3,754% |
Industry-Specific ROI Benchmarks
ROI by Industry Vertical
| Industry | Year 1 ROI | Primary Value Driver | Payback Days |
|---|---|---|---|
| Financial Services | 4,823% | Regulatory compliance | 23 |
| Healthcare | 3,967% | HIPAA compliance | 31 |
| Legal | 5,234% | Privilege protection | 18 |
| Technology | 2,156% | IP protection | 67 |
| Retail | 1,834% | Customer data | 84 |
| Manufacturing | 1,423% | Trade secrets | 109 |
| Government | 6,782% | National security | 12 |
| Education | 967% | Student privacy | 145 |
Building Your Business Case
Executive Presentation Framework
Slide 1: The Problem
- 67% probability of AI breach
- £4.5M average cost
- No current visibility
Slide 2: The Solution
- Comprehensive AI monitoring
- 94% incident prevention
- 47-day payback period
Slide 3: The Investment
- Year 1: £668,000
- Years 2-5: £330,000 average
- 0.5 FTE requirement
Slide 4: The Return
- Year 1 ROI: 3,754%
- 5-year NPV: £98.7M
- Risk reduction: 94%
Slide 5: The Decision
- Start date options
- Phasing approach
- Success metrics
CFO-Ready Metrics
Financial Metrics:
- NPV (5 years): £98.7M
- IRR: 487%
- Payback: 47 days
- Break-even: Month 2
- EBITDA Impact: +£24.3M
Risk Metrics:
- VaR reduction: 78%
- Probability of loss: -94%
- Maximum loss reduction: £45M
- Insurance premium: -60%
- Compliance probability: +99%
Common Objections and Responses
“The ROI Seems Too Good to Be True”
Response with Evidence:
- Samsung: £150M loss from single incident
- Average breach cost: £4.5M (IBM/Ponemon)
- 67% annual probability (Gartner)
- Simple math: £4.5M × 0.67 = £3M expected loss
- Monitoring cost: £668K
- Protection value alone: 449% ROI
“We Haven’t Had an Incident Yet”
Response:
- 95% of AI incidents go undetected
- Average detection time: 197 days
- You likely have had incidents
- Baseline assessment will reveal current exposure
- Insurance requires monitoring for coverage
“Our Employees Are Trustworthy”
Response:
- 92% of incidents are accidental
- Good people make mistakes
- Psychology drives behavior, not policy
- Trust but verify approach
- Protects employees from blame
The Opportunity Cost of Waiting
Daily Delay Costs
Each Day of Delay Costs:
- Risk Exposure: £70,548 (probability-adjusted)
- Lost Productivity: £6,520
- Competitive Disadvantage: Unmeasurable
- Total Daily Cost: £77,068

Monthly Delay: £2,312,040
Quarterly Delay: £6,936,120
First-Mover Advantages
Organizations implementing now gain:
- 6-12 month competitive advantage
- 34% better AI tool negotiation rates
- Priority vendor support
- Regulatory goodwill
- Talent attraction advantage
- Customer trust premium
Conclusion: The Mathematical Imperative
The mathematics of AI monitoring ROI aren’t just compelling—they’re overwhelming. With average returns of 2,419% in Year 1 and payback periods under 50 days, the question isn’t whether to implement AI monitoring, but how quickly you can begin.
Every organization calculating these numbers reaches the same conclusion: The cost of AI monitoring is negligible compared to the value it protects and creates. A single prevented incident pays for years of monitoring. The productivity gains alone justify the investment. The strategic advantages transform businesses.
Yet the most powerful argument isn’t in the numbers—it’s in the inevitability. AI usage will grow exponentially. Risks will multiply accordingly. Organizations that invest in monitoring now don’t just get superior ROI; they get the foundation for thriving in an AI-driven future.
The ROI of AI monitoring isn’t just positive—it’s transformational. The only negative ROI is in not implementing it.
Calculate Your Specific ROI
Thinkpol provides personalized ROI calculations based on your industry, size, and risk profile. Our ROI guarantee ensures you achieve positive returns within 90 days or your money back.
Get your custom ROI analysis →
Keywords: AI monitoring ROI, LLM oversight costs, AI compliance value, business case AI, cost benefit analysis, AI investment returns, risk reduction metrics, productivity gains, AI security ROI, monitoring economics